
LEED EAp2 Energy Modeling for a Mixed-Use Office Tower
A whole-building energy model developed for a 24,000+ m² mixed-use office tower to support LEED EAp2 performance evaluation. Baseline and Proposed models were built in DesignBuilder/EnergyPlus under ASHRAE 90.1-2016 Appendix G, with detailed representation of HVAC, central plant operation, site energy, utility cost, GHG emissions, and model performance validation.
Challenge
The assignment required a defensible comparison between a detailed Proposed design and a rules-based Appendix G Baseline for a large, curtain-wall-dominated mixed-use tower. Appendix G's Performance Rating Method only produces a meaningful result when the Baseline and Proposed models stay consistent with each other everywhere it matters — envelope assumptions, internal loads, occupancy and HVAC schedules, system configuration, central plant operation, outdoor air, and utility tariffs all have to be built on the same logic before they're compared. On a building this size, with a curtain-wall facade driving a large share of the load, small inconsistencies in any one of these areas can shift energy consumption, cost, and GHG results enough to change the outcome — including how HVAC operates and whether unmet load hours stay within the applicable threshold.
Approach
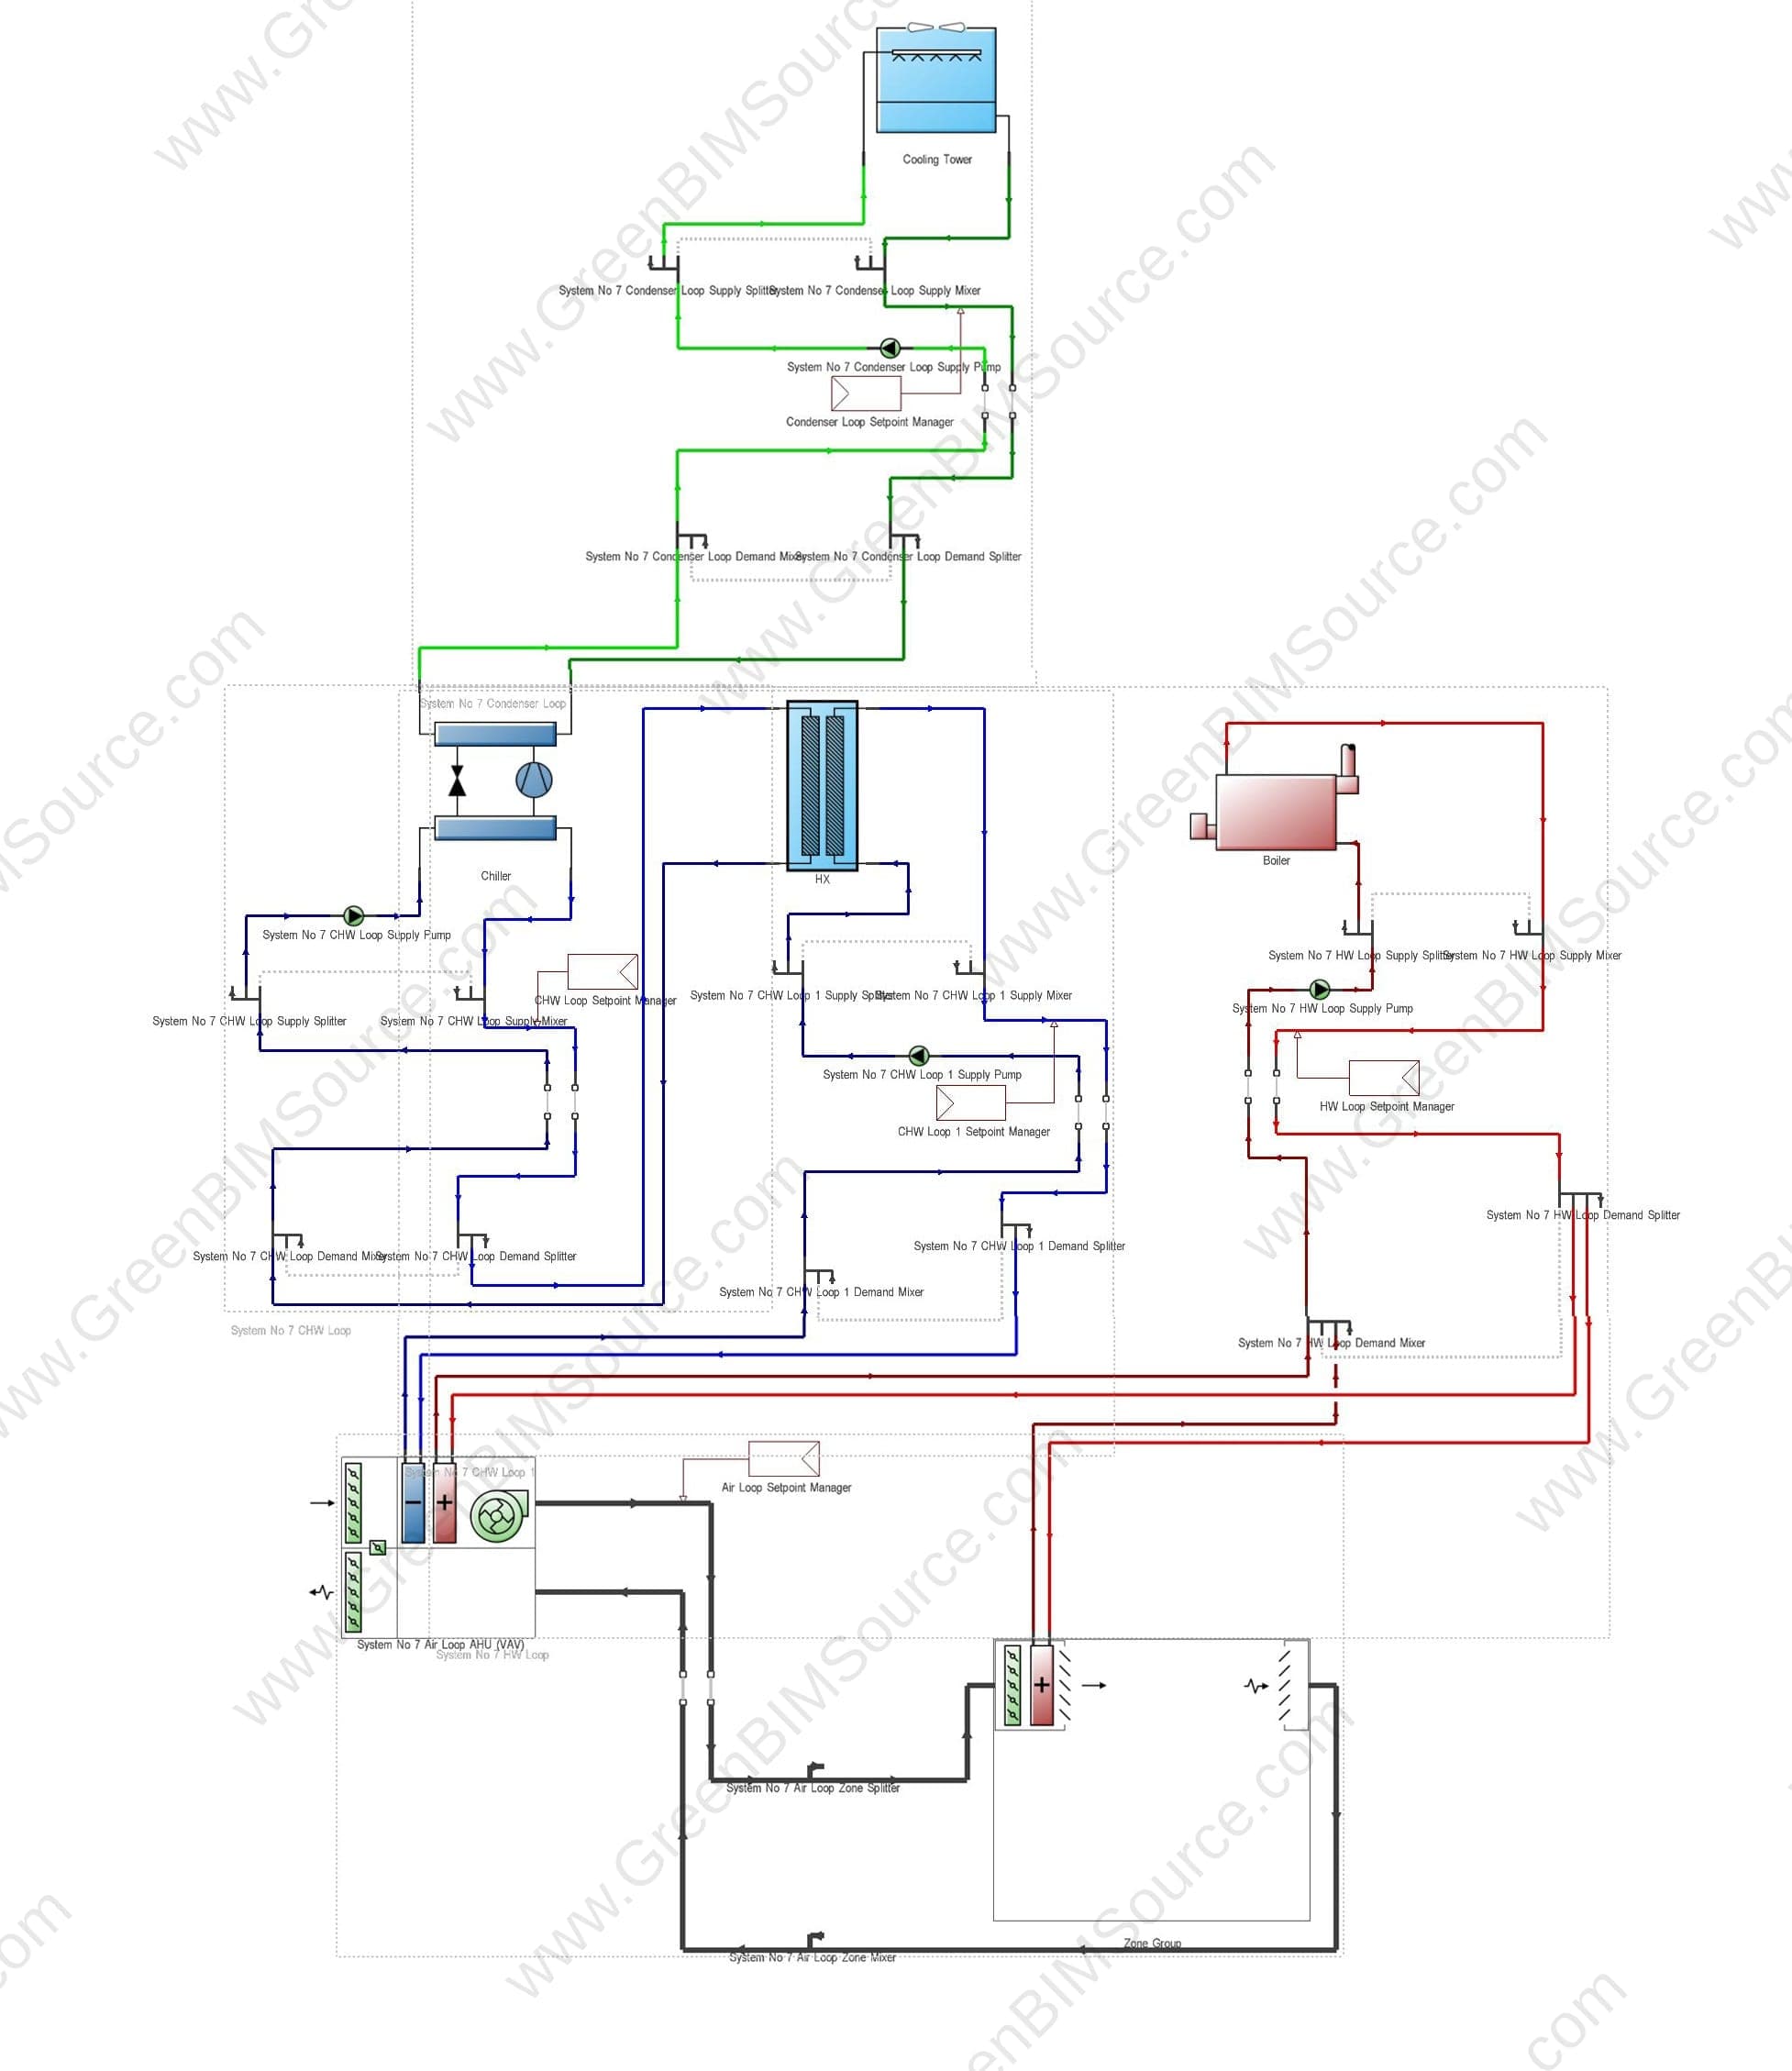
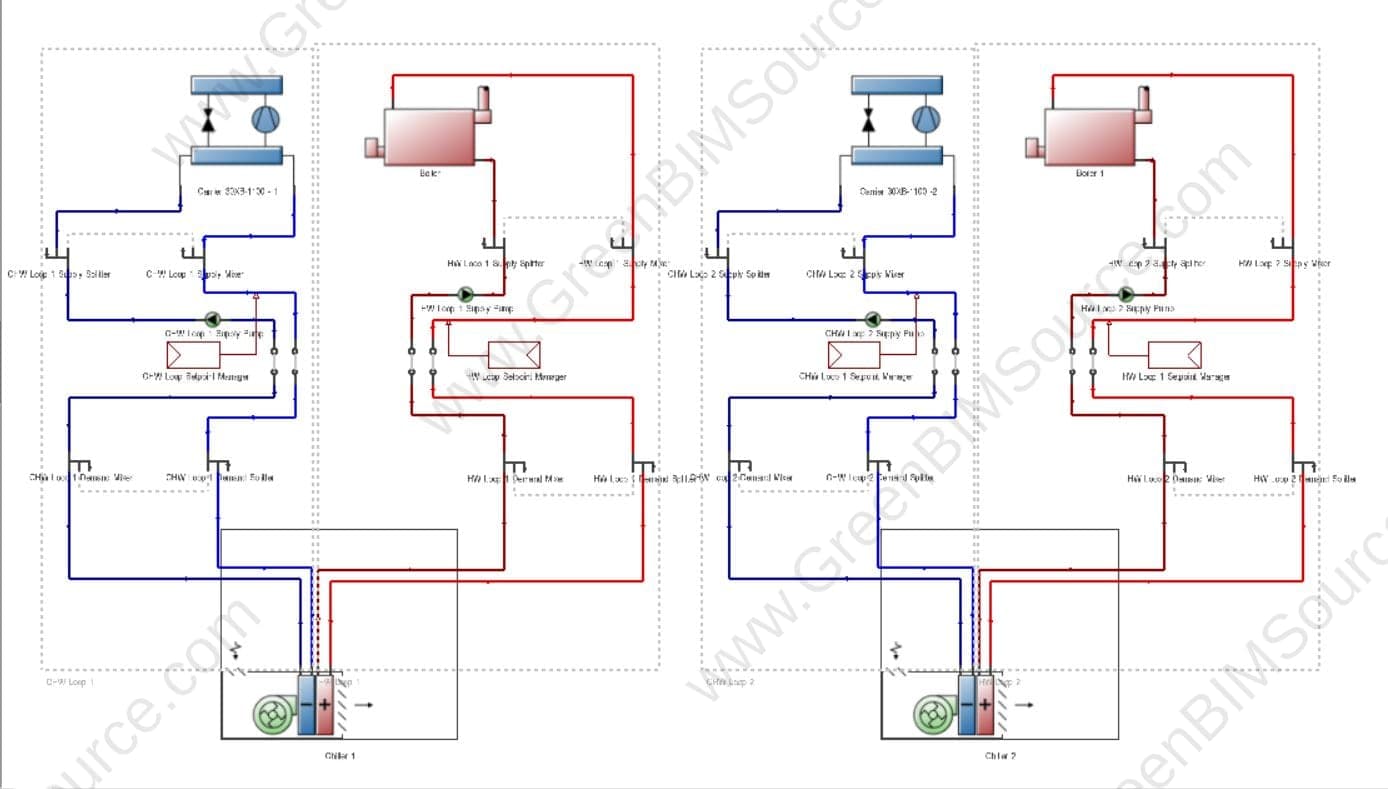
GreenBIMSource developed and QA-checked both the Proposed and Appendix G Baseline models in DesignBuilder/EnergyPlus. The Proposed model was built from the available design information, including the building's dynamic shading and curtain-wall glazing. The Baseline model was developed independently under Appendix G's rules-based requirements — Table 5.5-2 prescriptive glazing, a code-baseline wall assembly, and an ASHRAE System Type 7 HVAC system (VAV with reheat) served by a central plant with two chillers and two boilers, sized and operated per Appendix G with the required Building Performance Factor correction applied. Both models carried matching occupancy schedules, HVAC availability schedules, and outdoor-air requirements under ASHRAE 62.1, reviewed for consistency alongside plant sizing and system operating logic. Utility tariffs were configured to reflect the applicable electricity and natural gas rate structure. Once both models were complete, we reviewed end-use results, checked unmet load hours, and evaluated site energy, cost, and GHG performance before preparing the LEED EAp2 / PCI outputs used for the credit submission.
Model QA & Troubleshooting
Simulation outputs weren't accepted at face value. During QA, we reviewed occupancy and HVAC availability schedules, thermostat setpoints, system operating logic, zone conditions, and plant behavior against the unmet-load-hour results. The occupancy and HVAC operating schedules weren't initially aligned — occupied periods and system availability didn't line up consistently across all zones, which affected how the model represented conditioning during those hours. Correcting the schedule alignment and operating logic brought the results into a consistent, physically reasonable pattern, and unmet load hours came in within the applicable ASHRAE threshold. Model logic was verified before equipment assumptions were changed.
Deliverables
- Proposed DesignBuilder/EnergyPlus whole-building energy model
- ASHRAE 90.1-2016 Appendix G Baseline model
- HVAC System Type 7 and central plant modeling
- Envelope, schedule, outdoor-air, tariff, and operating-logic QA
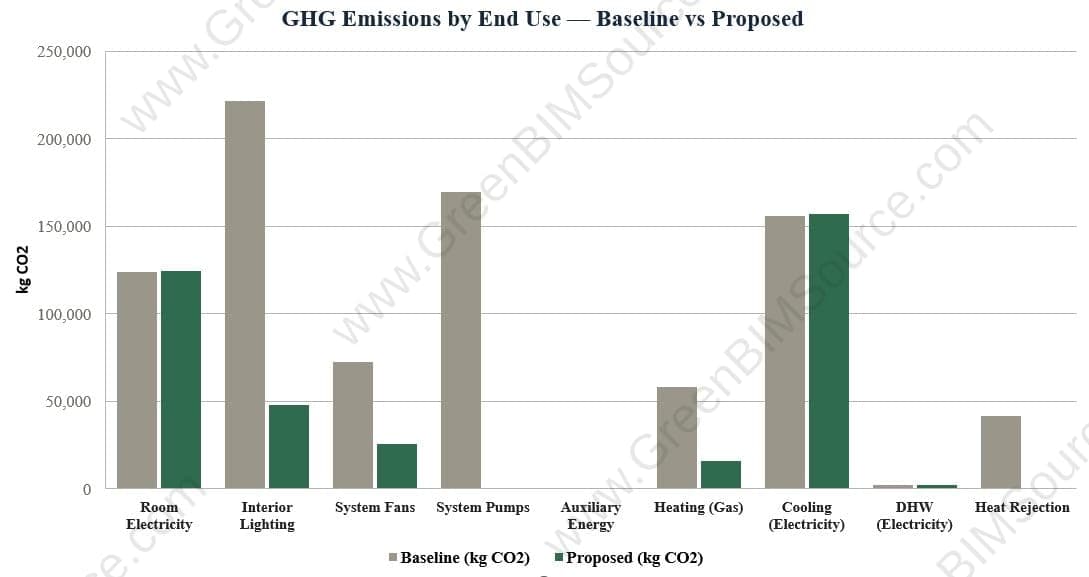
- Site energy, cost, GHG, end-use, and unmet-load-hour analysis
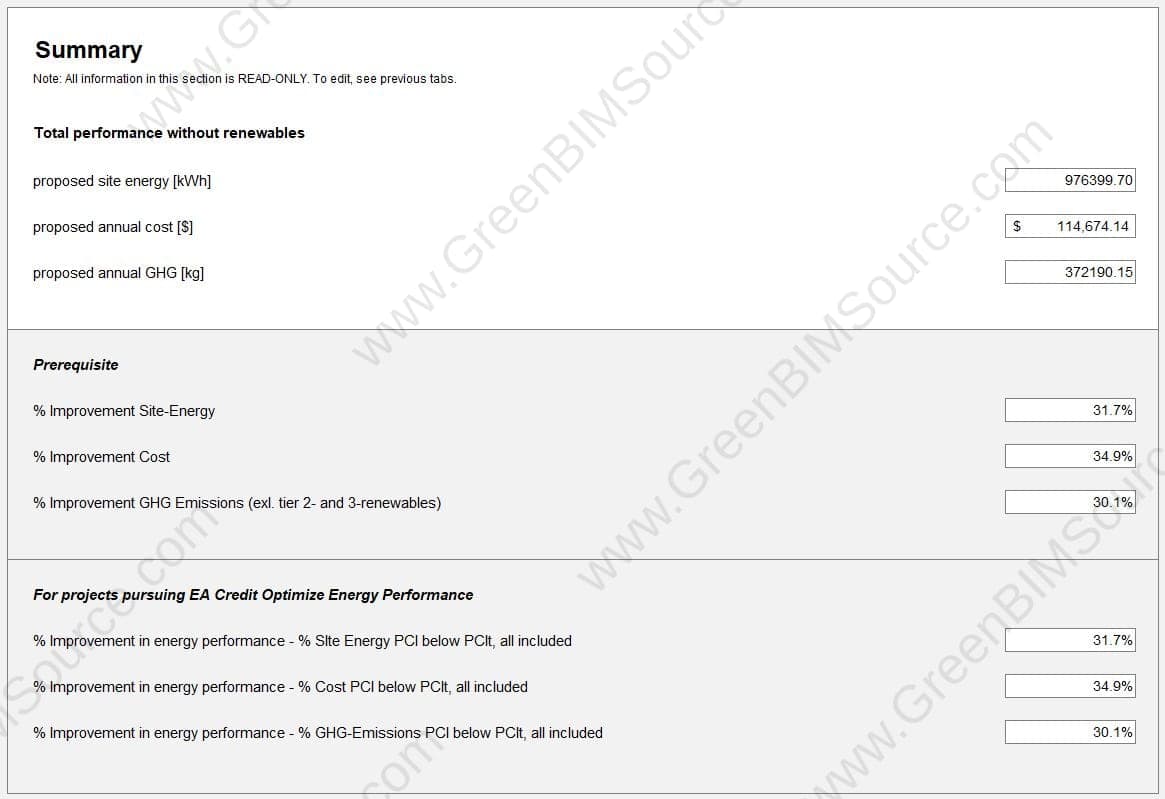
- LEED EAp2 / PCI performance documentation
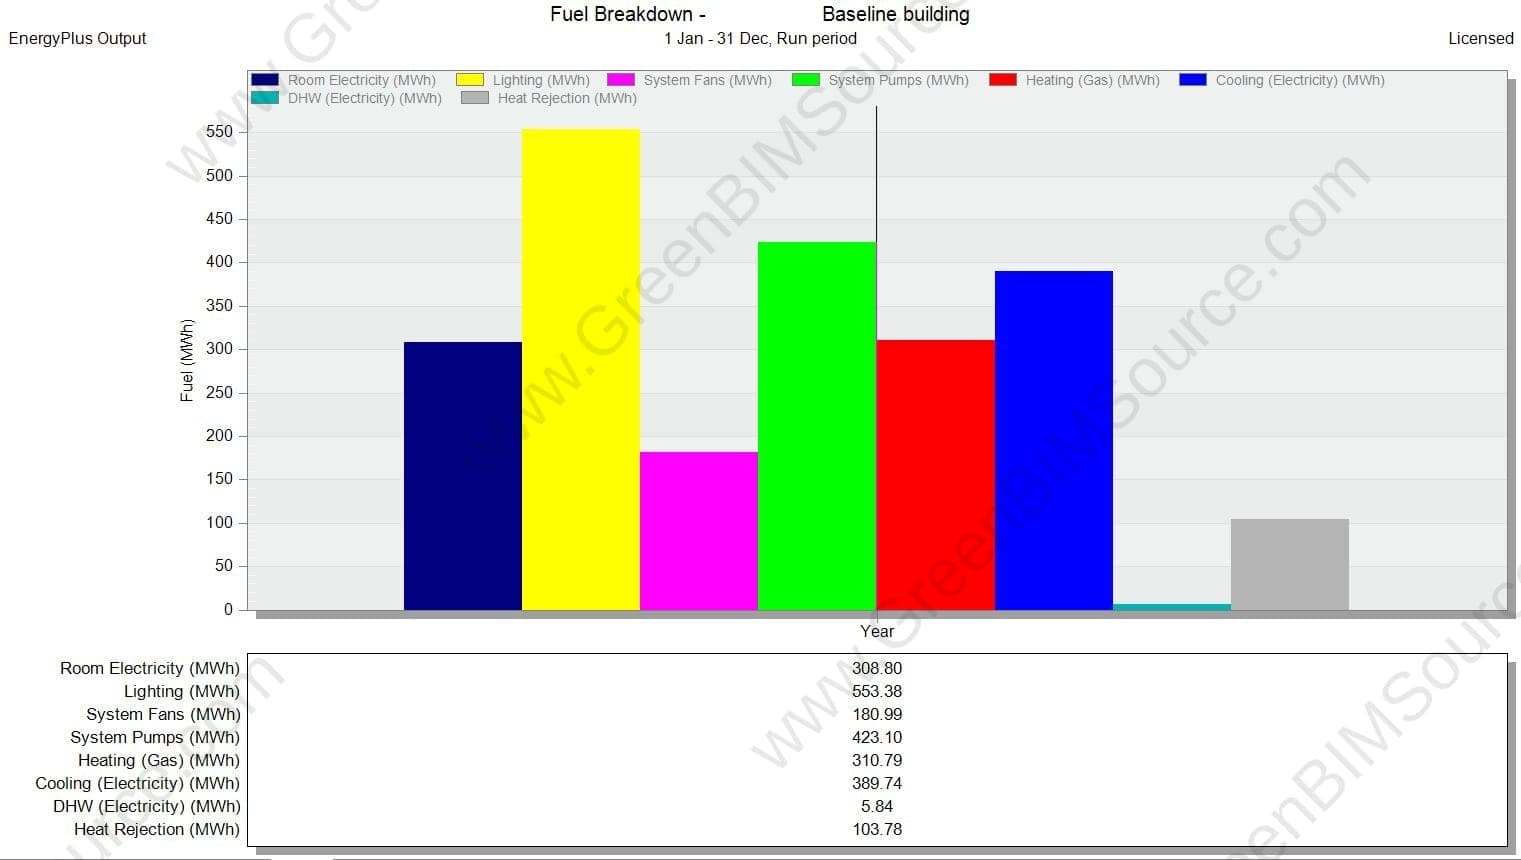
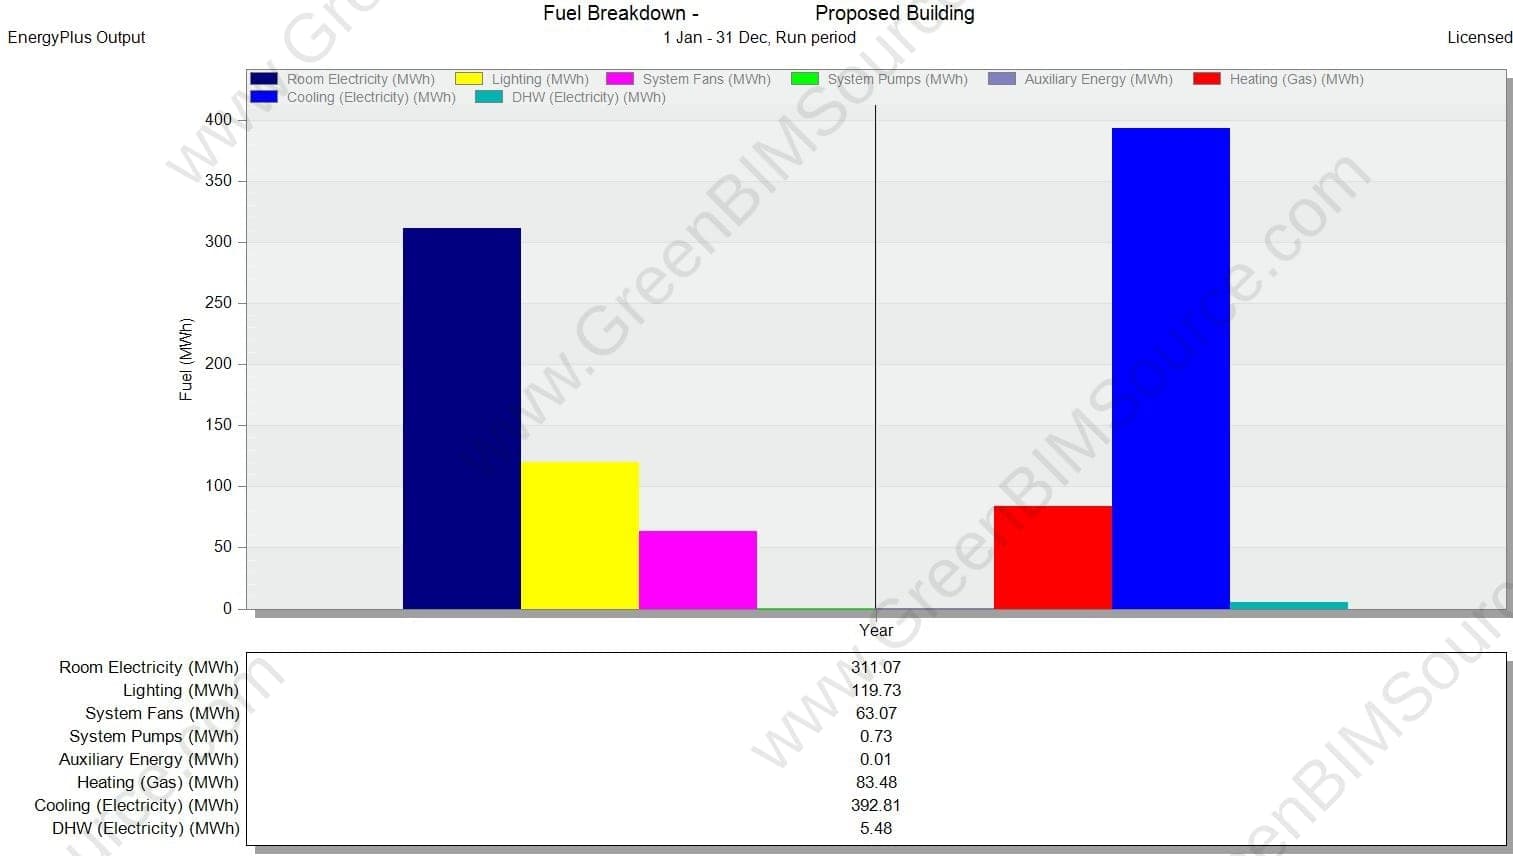
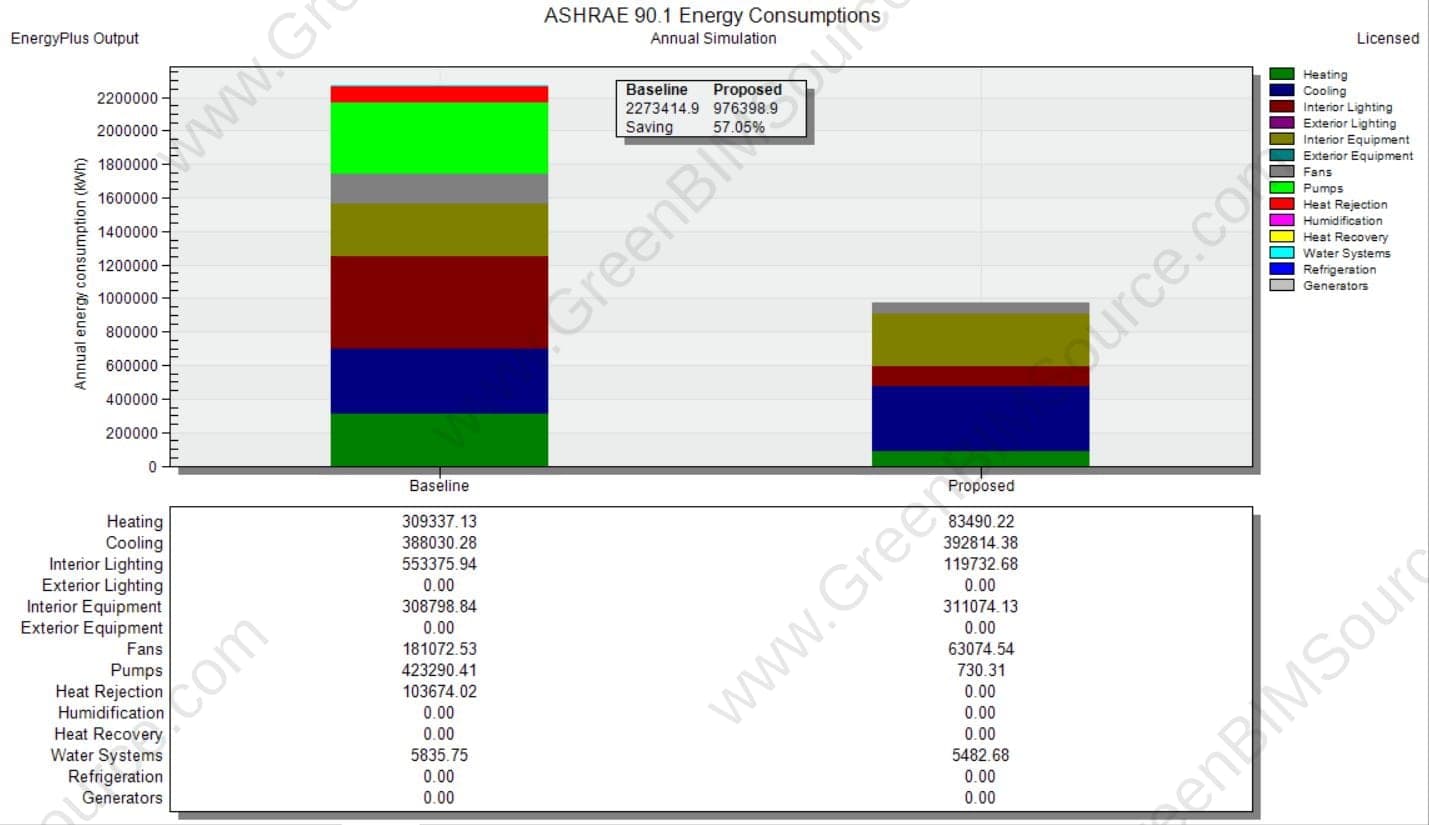
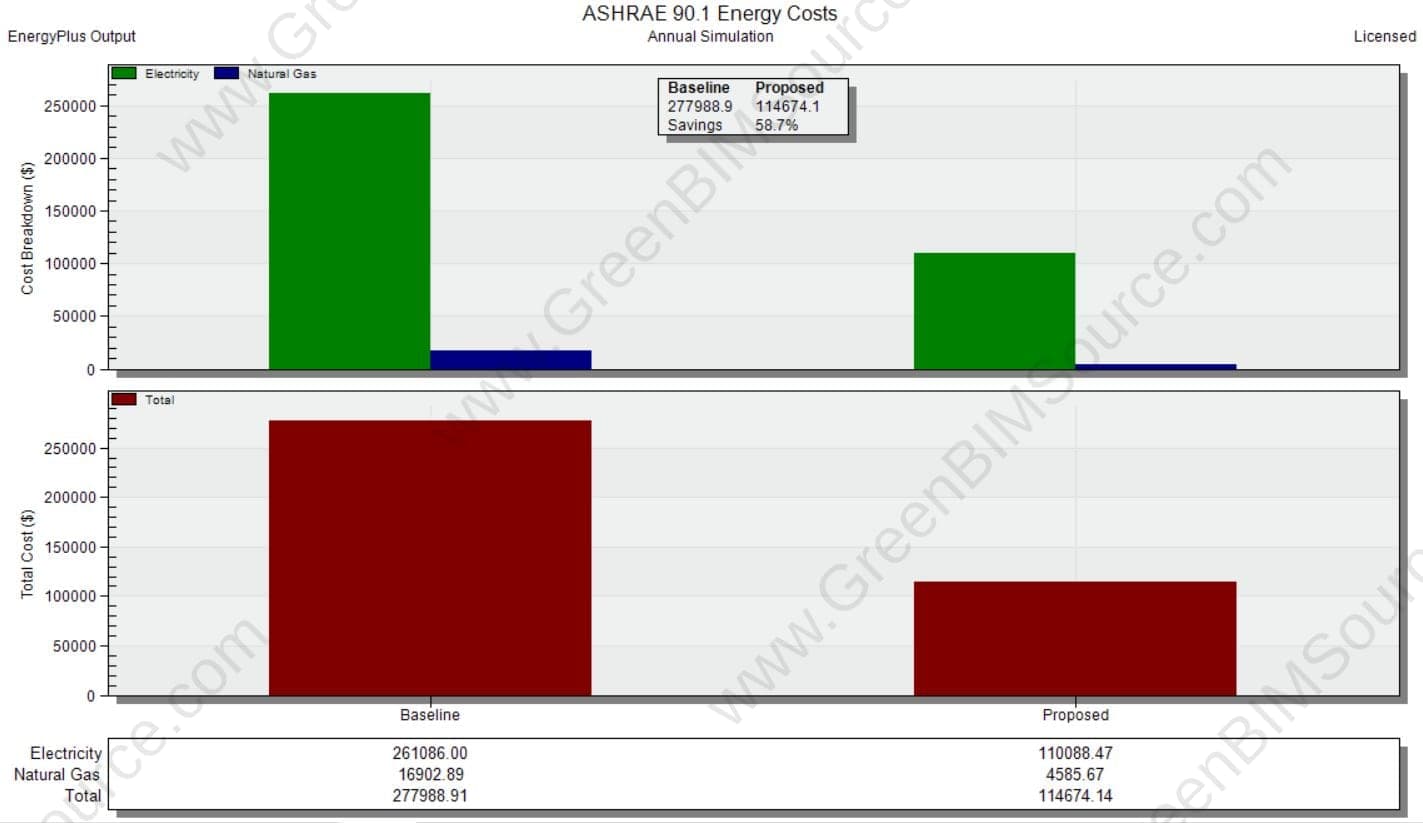
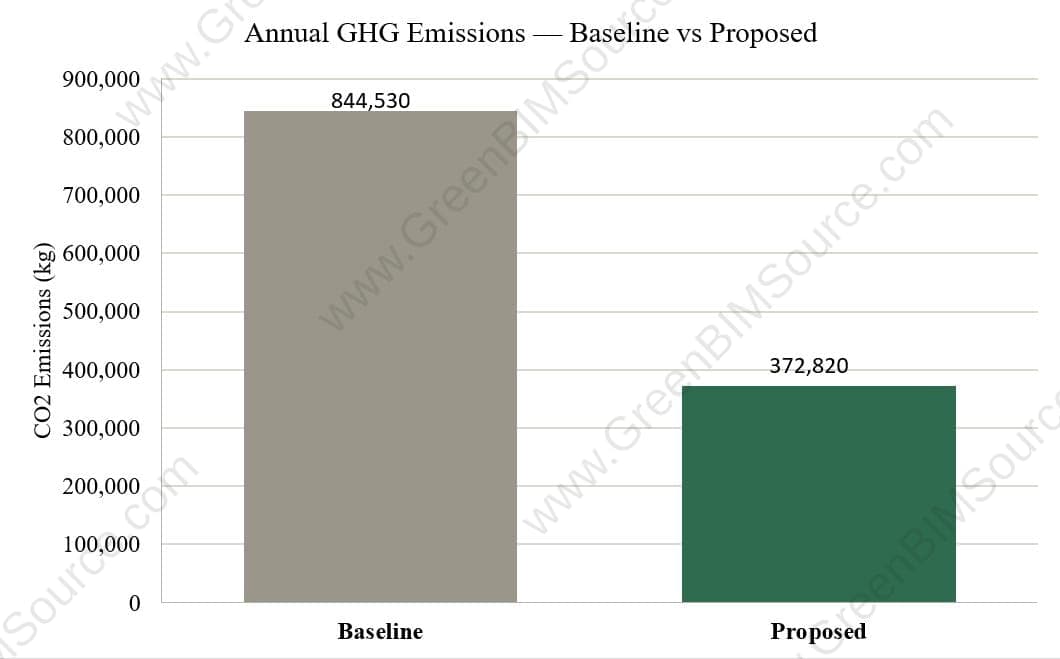
Direct annual Baseline vs. Proposed comparison
Performance relative to the applicable PCIt
The direct annual figures above compare simulated Baseline and Proposed building performance. The LEED/PCI percentages represent improvement relative to the applicable Performance Cost Index Target (PCIt) after the Appendix G methodology is applied — the two are calculated differently and shouldn't be read interchangeably.
Unmet load hours remained within the applicable ASHRAE compliance threshold.
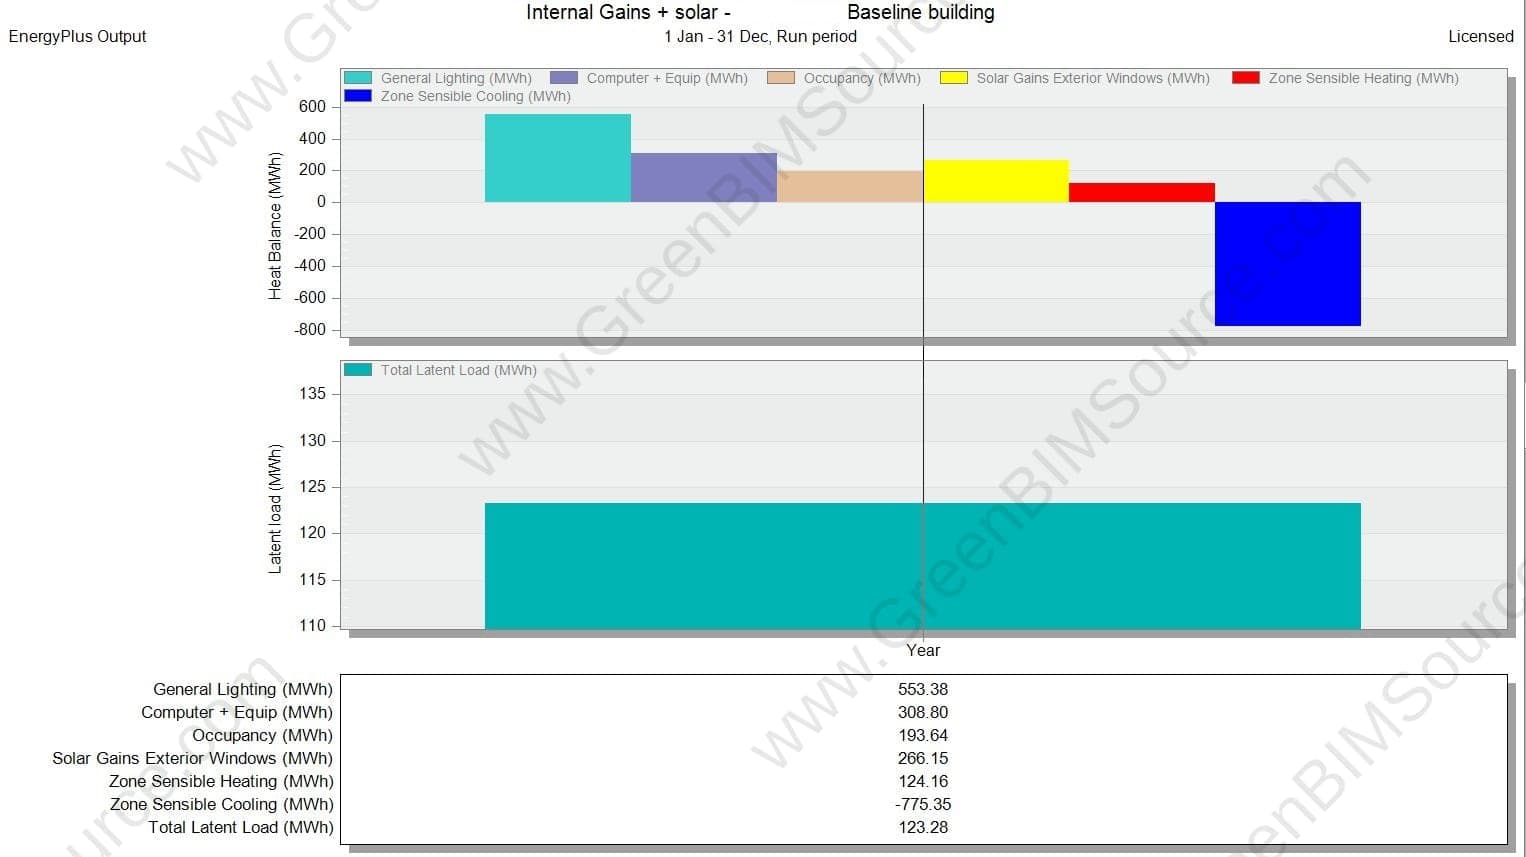
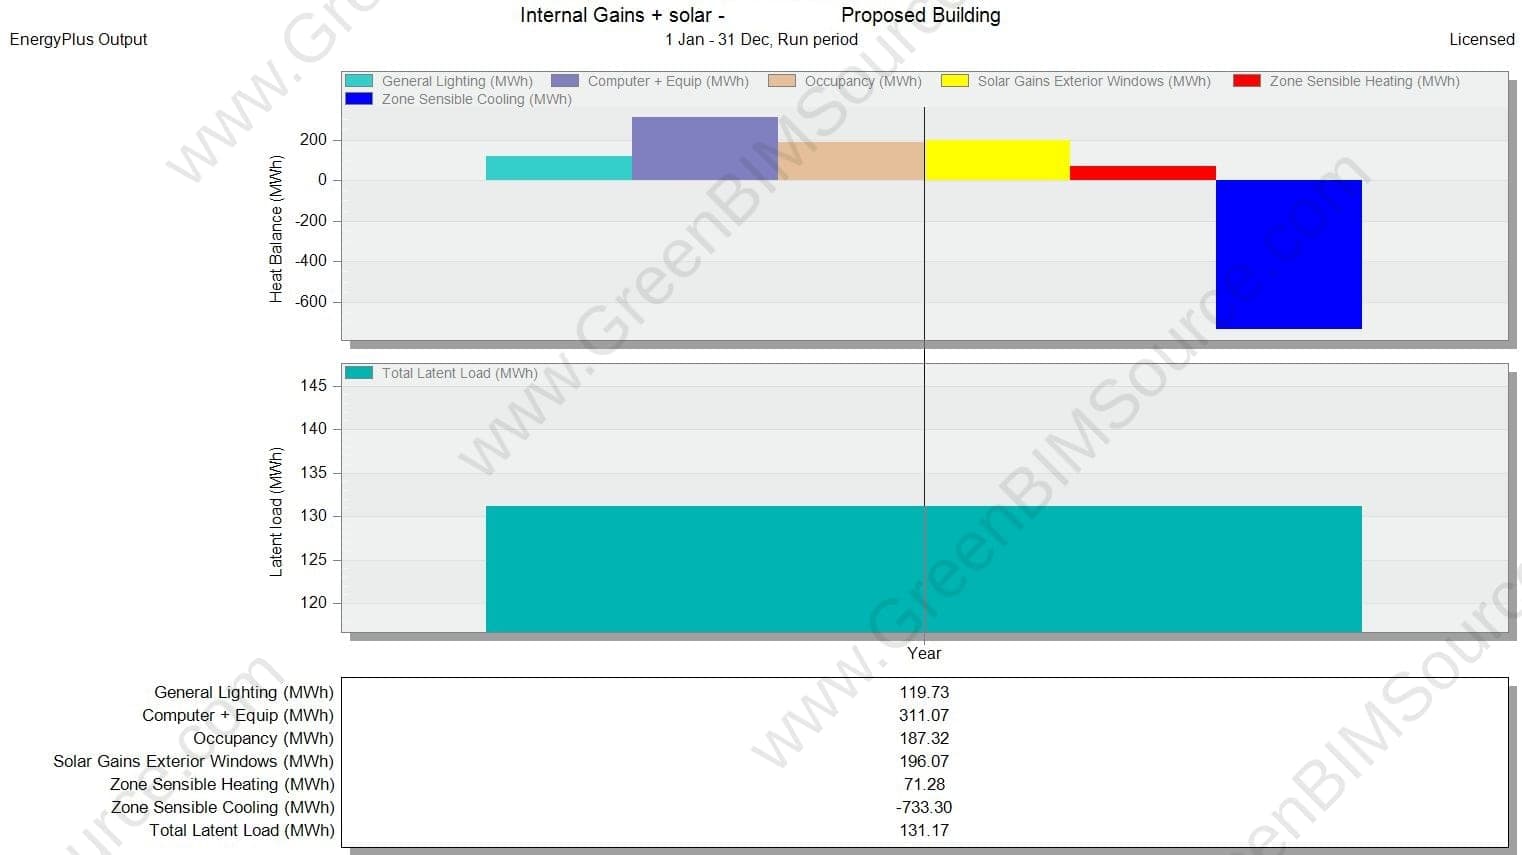
This project involved more than building a 3D energy model. It required developing detailed Baseline and Proposed models under Appendix G, representing HVAC and central plant operation accurately, and validating that schedules, system logic, and simulation outputs told a physically consistent story before any results could be trusted. The QA process — checking schedule alignment and operating logic rather than defaulting to equipment changes — is what made the final energy, cost, and GHG figures defensible. The completed model supported utility-cost analysis, GHG evaluation, and the LEED EAp2 / PCI documentation required for the credit submission.
Explore our Energy, Building Performance & Sustainability servicesHave an Energy & Sustainability project to discuss?
Send us your drawings, model, or project brief and we'll get back to you with scope and turnaround.